자동제어 | 2차 시스템의 Nyquist Plot |
페이지 정보
작성자 cemtool 작성일14-08-08 11:47 조회17,812회 댓글0건본문
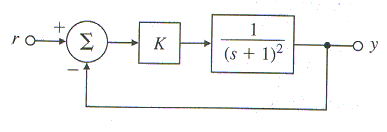
다음 그림과 같이 정의된 시스템의 안정성(stability)을 조사하시오.(Root locus, Bode plot, Nyquist plot 등을 그려서)

- ex6_8p.cem
/*
 Example 6.8 Nyquist Plot for a Second-order System
*/

del *;
"************************************************"
"**                                            **"
"**                 example 6.8                **"
"**   Nyquist Plot for a Second-order System   **"
"**                                            **"
"************************************************"
" "
sleep(2);
" "
" r--O--->[K]--->[1/(s+1)^2]--->"
"   -|                       |  "
"    |                       |  "
"    -------------------------   "
" "
sleep(2);

num = 1;
den = [1 2 1];

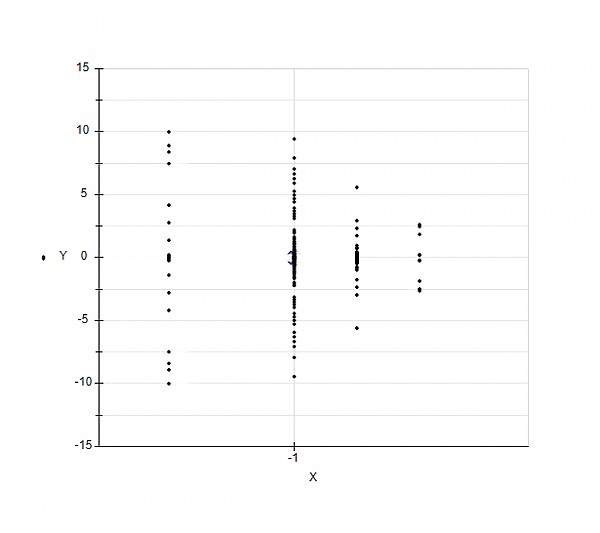
"Root locus"
" "
// Figure 6.20 - Root locus
figure(1);
rlocus(num,den);

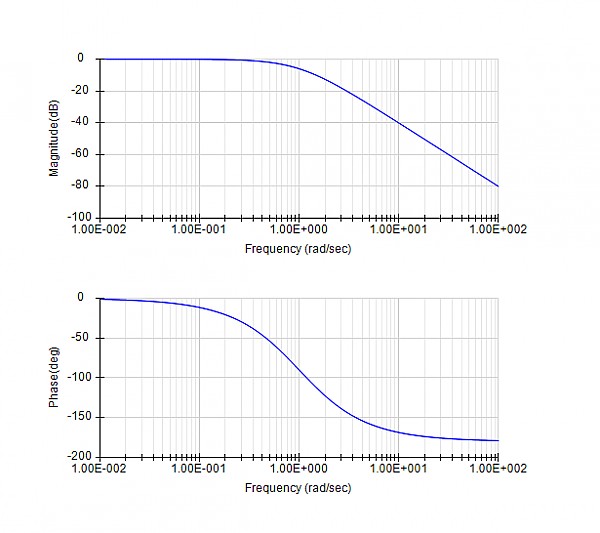
"Bode plot"
" "
// Figure 6.21 - Open loop Bode plotfigure(2);
w = logspace(-2, 2, 1000);
bode(num,den,w);

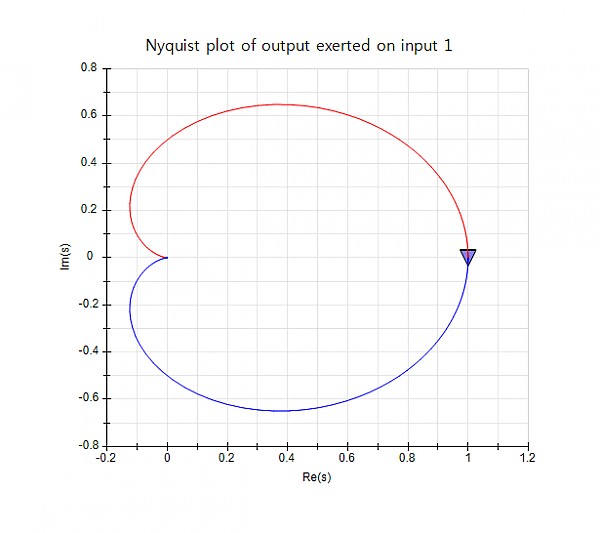
"Nyquist plot"
" "
// Figure 6.22 - Nyquist plotfigure(3);
nyquist(num,den);
댓글목록
등록된 댓글이 없습니다.


